For years, climate debates have revolved around numbers that are difficult for most people to picture.
Millions of tonnes of carbon dioxide.
Parts of a degree of warming.
Gigatonnes of emissions.
Carbon budgets.
They are scientifically important, but they can feel distant from everyday life.
A new tool launched by researchers in Australia is trying to change that.
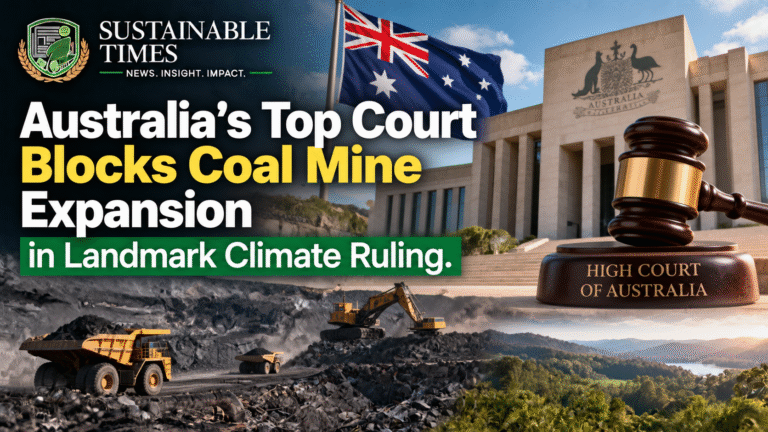
The Carbon Impacts Tracer takes the emissions associated with an individual fossil-fuel project and translates them into estimated real-world consequences, including heat exposure, crop losses, coral damage and other environmental and human impacts.
The tool launches today, 29 September, through researchers at the Australian National University and the Australian Climate Accountability Project at the University of New South Wales. It builds on recent climate-attribution research that has made it increasingly possible to connect emissions from a specific project with measurable climate damage.
That could change the way people understand the climate cost of a new coal mine, gas field or oil project.
Instead of asking only “How many tonnes will it emit?”, the public can begin asking:
“What will those emissions actually do?”
The problem with a very large number
Consider 809 million tonnes of carbon dioxide.
That is roughly the amount of emissions associated with the proposed extension of the Hunter Valley Operations coal mine in New South Wales, according to the analysis reported alongside the launch of the tool.
For most people, 809 million tonnes is almost impossible to visualise.
It is an enormous number, but it does not immediately tell us what that number means for people, food systems, ecosystems or future temperatures.
The Carbon Impacts Tracer attempts to bridge that gap.
Using established climate science, it estimates the additional warming associated with a project’s emissions and then connects that warming to specific consequences where peer-reviewed research provides a sufficiently robust relationship.
The current version covers eight impact categories.
They include effects such as crop losses, human exposure to extreme heat, glacier loss, coral mortality and other climate-related consequences.
The result is a very different way of looking at emissions.
A tonne of carbon is no longer just a number on an emissions spreadsheet.
It becomes part of a chain.
Project → emissions → warming → impact.
A tiny temperature number can hide a huge consequence
One of the most striking aspects of the tool is how it deals with temperature increases.
The additional warming associated with one individual project can look almost meaningless when expressed in degrees Celsius.
For example, RenewEconomy’s reporting on the Hunter Valley Operations case says the project’s estimated contribution is around 0.00036°C, with an uncertainty range around that estimate.
That sounds insignificant.
It is not.
The temperature increase becomes meaningful when scientists connect it to the physical changes that follow.
The tool estimates that the emissions associated with the proposed HVO extension could push around 325,000 additional people outside what researchers describe as the “human climate niche” and contribute to the loss of around 14.7 million additional coral colonies per bleaching event, among other impacts.
These are estimates, not predictions of exactly what will happen to a particular individual coral colony or person.
That distinction matters.
But the numbers demonstrate why focusing only on the temperature contribution of one project can obscure the consequences.
This is where climate attribution becomes powerful
Climate attribution has developed rapidly over the past decade.
Scientists can increasingly determine how much human-caused climate change contributed to particular extreme events.
The new Carbon Impacts Tracer takes that idea in another direction.
Instead of starting with a heatwave or flood and asking how much climate change influenced it, the tool starts with a specific source of emissions.
It then works forward.
How much warming could those emissions produce?
What consequences are associated with that warming?
And how can scientists quantify those consequences?
The developers say the tool uses published research and applies a high evidence threshold. That is why it currently includes only eight types of damage rather than trying to put a number on every possible consequence of climate change.
That restraint is important.
A tool designed to improve accountability loses credibility if it pretends that scientists can calculate everything with precision.
The technology is arriving at an important moment
The Carbon Impacts Tracer is not being launched in isolation.
Governments and companies continue to make decisions about new fossil-fuel infrastructure while renewable energy expands rapidly around the world.
Those decisions involve jobs, energy security, regional economies, electricity prices and national development.
They also involve climate impacts that can extend far beyond the location of the project.
That creates a difficult policy question.
If a project generates economic benefits in one region but produces emissions whose effects spread across the planet, who should account for those costs?
Historically, that question has been difficult to answer with project-level evidence.
The new tool is designed to make that connection easier to see.
Australia provides a particularly interesting test
Australia is one of the world’s major exporters of coal and gas.
It is also experiencing a rapid expansion of renewable energy.
That puts the country at the centre of a complicated energy debate.
The Carbon Impacts Tracer’s developers have applied the methodology to several fossil-fuel projects in Australia and one in the United Kingdom.
The Hunter Valley Operations mine extension is particularly significant because a decision on the project is expected around the time of the tool’s launch.
That makes the timing impossible to ignore.
A project that once could be discussed primarily through economic output and tonnes of coal can now also be discussed through estimated impacts on food production, heat exposure and ecosystems.
The numbers do not decide whether a project should proceed.
They give decision-makers another set of information.
The Great Barrier Reef becomes part of the calculation
Coral reefs are among the most visible casualties of a warming ocean.
Australia’s Great Barrier Reef has experienced repeated mass bleaching events as marine heatwaves become more severe.
The Carbon Impacts Tracer connects fossil-fuel emissions to additional coral loss during future bleaching events where the scientific evidence allows that relationship to be quantified.
For the HVO example, the tool estimates around 14.7 million additional coral colonies lost per bleaching event from the project’s emissions.
Again, this is not saying that someone can point to a particular coral colony and prove that one project’s emissions killed it.
The calculation works at a global climate-system level.
But it provides something that conventional emissions accounting does not:
a way to express a project’s climate contribution in ecological terms.
That can make an abstract emissions figure much easier to understand.
Food is another part of the story
Climate change is often discussed through temperature records and extreme weather.
But food production may be one of the most consequential ways climate change reaches everyday life.
Heat can reduce crop yields.
Drought can damage harvests.
Floods can destroy fields.
Changing rainfall can disrupt planting and harvesting.
The Carbon Impacts Tracer includes agricultural yield impacts among the areas it can estimate.
This creates a powerful connection.
A fossil-fuel project is not simply producing emissions.
Those emissions contribute to warming.
Warming can influence agricultural productivity.
And agricultural losses eventually affect food availability, prices and livelihoods.
The chain may stretch across continents, but it begins with a measurable quantity of emissions.
The tool could change climate litigation
This may be where the Carbon Impacts Tracer becomes especially significant.
Climate litigation has grown around the world, with communities, organisations and governments increasingly asking courts to examine responsibility for climate-related harm.
One challenge has been establishing a sufficiently strong causal connection between a particular company’s or government’s emissions and specific harms.
The Australian Human Rights Institute says the new tool builds on attribution science that can increasingly trace the impacts of individual fossil-fuel projects.
That does not mean a calculator automatically establishes legal liability.
Courts still need to consider evidence, legal standards, causation, responsibility and jurisdiction.
But better scientific attribution can strengthen the evidence available to lawyers and affected communities.
It could also make arguments about the supposedly negligible effect of one project harder to sustain.
The “drop in the ocean” argument is becoming harder to make
There is a familiar argument in debates over individual fossil-fuel projects.
One project is too small to change the climate.
Therefore, its emissions are insignificant.
At first glance, that sounds logical.
But climate change does not work as a collection of isolated projects.
Every tonne adds to atmospheric carbon dioxide.
The scientific relationship between cumulative CO₂ emissions and warming allows researchers to estimate the contribution of individual sources.
The Carbon Impacts Tracer makes that relationship easier for non-specialists to understand.
A single project may indeed represent a small fraction of global emissions.
But “small” and “zero” are not the same thing.
The new tool puts that distinction into numbers.
It also exposes the limits of what we can calculate
There is an important reason not to treat the tool as a crystal ball.
Climate impacts contain uncertainty.
Scientists cannot currently quantify every consequence of every tonne of emissions.
The tool’s developers deliberately restrict its calculations to impacts where they believe the underlying scientific evidence is strong enough.
For example, the methodology can estimate certain heat-related impacts in Europe because researchers have established a robust relationship between warming and heatwave mortality there.
It does not simply assume that the same calculation works equally well for every region.
That scientific caution is one of the tool’s strengths.
The objective is not to create the biggest possible number.
It is to create a defensible one.
Businesses may soon have to think about emissions differently
Carbon accounting has traditionally focused on measurement.
How much did the company emit?
How much did its suppliers emit?
How much did its products contribute?
That information remains essential.
But tools such as the Carbon Impacts Tracer point toward another layer of accountability.
What does that emission actually mean?
For an energy company, that could mean estimating the consequences associated with a proposed project.
For a bank, it could mean thinking differently about the climate implications of project finance.
For an insurer, it could provide another way to assess long-term exposure.
For investors, it could add another dimension to climate-risk analysis.
For governments, it could help communicate the consequences of infrastructure decisions.
And for the public, it can make climate science much easier to understand.
This could also change how sustainability reports communicate
Corporate sustainability reports are full of tonnes of CO₂.
The numbers are useful, but they can be difficult for ordinary readers to interpret.
Imagine two companies reporting similar emissions.
One says:
“We emitted X million tonnes of CO₂.”
The other explains what that emissions level means in terms of climate contribution and the relevant environmental or social impacts, while clearly showing the assumptions and uncertainty.
The second approach tells a much more understandable story.
That does not mean every company should convert its emissions into dramatic impact statistics.
It means sustainability communication could increasingly move from measurement alone toward meaning.
Consumers, investors and policymakers are asking for more than numbers.
They want to understand consequences.
The technology also raises uncomfortable questions
A tool like this could make climate impacts easier to see.
But visibility does not automatically produce action.
A government can know that a project creates climate costs and still approve it.
A company can understand its emissions and still continue operating.
An investor can recognise climate risk and still prioritise short-term returns.
The real significance of the Carbon Impacts Tracer will therefore depend on what people do with the information.
Science can establish the connection.
It cannot make the political or economic decision.
That remains a human responsibility.
There is something bigger happening here
The Carbon Impacts Tracer represents a broader change in climate science.
For decades, climate change often appeared as a global statistical problem.
Global temperature.
Global emissions.
Global atmospheric carbon dioxide.
But people experience climate change locally.
They experience extreme heat.
Crop failures.
Coral bleaching.
Flooding.
Drought.
Economic disruption.
Health impacts.
The more scientists can connect global emissions with these concrete consequences, the easier it becomes to understand why individual decisions matter.
The distance between one project and one climate impact is becoming easier to measure.
That is a major development.
From carbon accounting to consequence accounting
The sustainability world has spent years improving carbon accounting.
Now a new question is emerging.
What comes after counting carbon?
One possible answer is counting consequences.
That does not replace emissions accounting.
It builds on it.
The amount of carbon emitted remains the starting point.
Climate science translates that into warming.
Impact research translates warming into consequences.
And tools such as the Carbon Impacts Tracer bring those steps together in a form that policymakers, researchers and the public can explore.
That could make climate information more tangible than ever before.
The most important change may be psychological
There is a huge difference between saying:
“This project will emit 809 million tonnes of CO₂.”
and saying:
“This project will contribute to measurable additional warming and associated impacts on people, food production, glaciers and coral ecosystems.”
Both statements describe the same underlying problem.
But the second makes the consequences much harder to ignore.
That may be the real power of the new tool.
Not that it produces another climate number.
But that it gives existing climate science a language people can understand.
A new era of climate accountability?
The Carbon Impacts Tracer does not settle the debate over fossil fuels.
It does not decide whether Australia, Britain or any other country should approve a particular mine, gas field or oil development.
It does something more fundamental.
It makes the consequences of those decisions easier to trace.
That matters because climate policy increasingly involves decisions about individual infrastructure projects, individual companies and individual investments.
The science is moving closer to the level at which those decisions actually happen.
And that could change the conversation.
The next time someone says that one fossil-fuel project is only a tiny fraction of global emissions, the response may no longer be simply:
“Every tonne matters.”
It may be:
“Here is what those tonnes are expected to do.”
That is a much harder question to dismiss.
About The Author